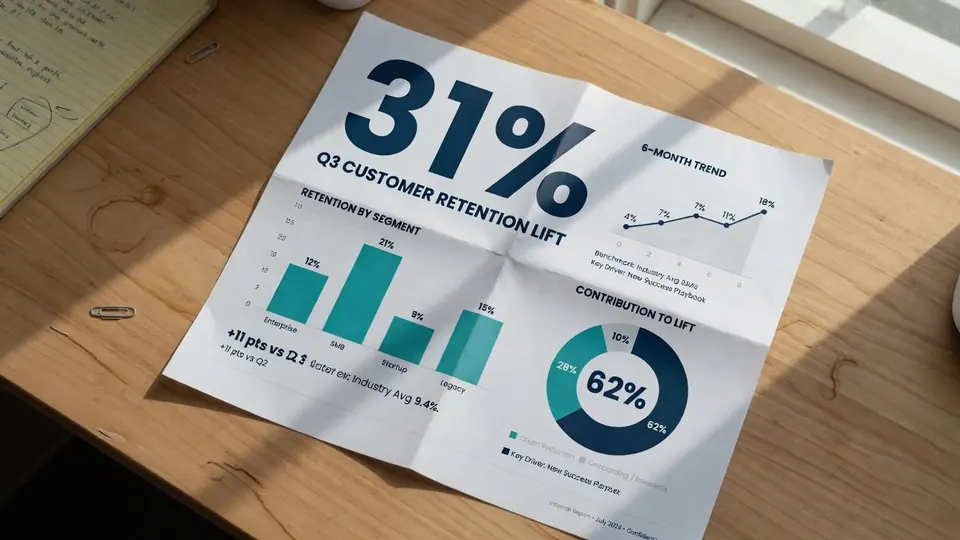
I still remember sitting at my desk late yesterday evening, staring at an infographic visual export on my monitor. The report graphic displayed an outdated survey result showing 42%, but our revised research dataset verified that the true figure had climbed to 57%. I needed to publish the graphic immediately, yet the original design workspace was completely unavailable.
Looking through our archives, I found only a flattened PNG graphic without separate layers or editable text boxes. If you create visual content often, you have probably run into this exact wall when handling previous deliverables. Rebuilding the entire graphic from scratch was impractical, so editing the raster pixels directly became my only realistic path forward.
Edit Text in Infographic
Update outdated metrics, headers, and stat labels on your finished infographic.
Always Check for Source Design Files First
Before touching any pixel manipulation software, you should always verify whether your team still has the original design workspace. If your source files from Figma, Adobe Illustrator, or Photoshop are still on your drive, you should always return to that original software and modify the text boxes natively. That approach preserves original vector shapes and guarantees perfect typographical fidelity without touching raster art.
Pixel replacement should only be your solution when you are stuck with a flattened graphic. Marketing teams, educators, and independent analysts frequently inherit static image assets whose raw project files were lost or archived across former team accounts. In those specific scenarios, working directly on image pixels saves you from having to redraw complex chart layouts.
What to Expect When Editing Raster Image Pixels
Editing flattened raster pixels requires an understanding of how graphical reconstruction works behind the scenes. When you replace letters embedded within an image, an automated visual engine analyzes the local textures, colors, and letterforms to synthesize replacement characters directly into the pixel grid. It is an intelligent best-effort match rather than a true font installation file, meaning it does not alter typography through vector font definitions.
Because the tool modifies flat raster bitmaps, the output is never a lossless vector file with detached layers. You are modifying flat pixels across static file formats like PNG, JPG, and WebP, rather than generating scalable vector outlines. Furthermore, the platform focuses on deliberate single-image workflows rather than automated high-volume pipelines, so there is no unlimited free plan and no batch processing API available.
You also retain complete control over the actual content because you type in your own replacement words manually. Automated tools detect text zones, but they should never guess what your data actually means. When you want to update visuals cleanly, using a dedicated Edit Text in an Infographic tool allows you to refresh stale figures while preserving surrounding background patterns.
Step 1: Upload Your Static Image Asset
To start updating your graphic, open your web browser and upload your static PNG, JPG, or WebP image directly into the workspace. The system immediately scans your picture to locate text boundaries and visual blocks across the composition. You do not need to worry about hidden platform costs during this initial scanning phase because automated detection does not deduct credits from your balance.
If you are new to the platform, you can explore the workflow using trial credits provided right after you complete your account login. These initial allowances let you test how text detection handles your specific layout without committing upfront payments. Once your file uploads, the detection framework highlights text regions across your chart automatically.
Step 2: Review and Organize Detected Text Lines
After the scan finishes, you will see a structured panel listing every text fragment found inside your graphic. Each detected line corresponds to an editable input box alongside a small lock toggle icon. You should inspect this list carefully to ensure that numbers, labels, and axis markers are mapped cleanly across the interface.
Sometimes your graphic contains intricate titles or complex brand watermarks that you want to keep entirely untouched. Whenever you see a detected line that needs no modification, simply click the lock toggle to freeze that line in place. Locking protects recognized lines from unintended rendering shifts while you work on other sections of your chart.
Step 3: Type Your Verified Replacement Text
Now you can enter your replacement data directly into the corresponding text fields on your screen. In my case, I located the specific label reading 42% and typed in the verified value of 57%. You can also leave an input field completely empty if you want to remove that specific line from the final picture.
Always double-check that your new values reflect genuine documentation before you move on to rendering. Every numerical label, product price, quantity indicator, or date must match authentic facts rather than arbitrary estimations. Maintaining strict data honesty ensures your published charts inform readers accurately instead of spreading deceptive metrics.
When you configure your text fields using an intuitive Infographic Text Editor, the visual layout stays organized while you make your corrections. The system holds your manual inputs and respects every locked line across the entire visual layout.
Step 4: Choose Your Desired Generation Resolution
Once your text inputs and locks are set, you select your preferred rendering resolution before generating the updated graphic. The platform uses a predictable credit structure where 1K generation costs 10 credits, 2K generation costs 20 credits, and 4K generation costs 30 credits. Choosing higher resolutions gives you crisper visual output for detailed diagrams or presentation slides.
Your resolution choice should match where your audience will view the graphic. For basic blog posts or social updates, a standard 1K render provides sufficient clarity while conserving your credit balance. If you plan to embed your graphic into large presentation decks or high-resolution reports, selecting 2K or 4K resolution ensures that small labels stay legible.
Step 5: Verify Visual Balance and Download the File
After you initiate the rendering process, the visual engine replaces the targeted pixels and synthesizes matching background textures behind the new lettering. When the image appears on your dashboard, examine the updated text area closely to make sure the replacement characters align naturally with neighboring elements. When you are satisfied with the visual outcome, download the finished static file to your computer.
Learning how to Edit Text in Image workflows gives you a practical fallback whenever source design documents go missing. You can quickly fix outdated labels without bothering your design colleagues for simple text adjustments. It turns a frustrating roadblock into a straightforward maintenance task that keeps your visual content accurate.
Ethical Guidelines for Modifying Image Graphics
Whenever you edit text directly inside a flattened image, you must hold the necessary rights or authorization to modify that visual asset. Never alter images belonging to third parties without explicit consent, and never use pixel editing tools to remove legitimate copyright notices or artist signatures. Respecting intellectual property maintains professional integrity across all digital publishing channels.
Furthermore, maintaining data truthfulness is essential when editing any chart or visual report. The percentages and statistics on your infographic represent calculated metrics that reflect reality, so you must never invent elevated numbers simply to make your narrative look more compelling. Truth in visual communication builds enduring trust with your audience, clients, and industry peers.
Commercial charts must reflect real prices, verified item counts, honest technical specifications, and authentic timelines. Modifying a flattened product graphic to show an unauthorized discount or a fake delivery window misleads buyers and damages business credibility. Treat every pixel edit with the same rigor you would apply to an official written contract.
Understanding the Technical Trade-offs of Pixel Editing
While pixel-level replacement provides tremendous convenience, you should always understand its technical boundaries. Because the software reconstructs pixels rather than loading licensed font files, slight variations in kerning or letter edge sharpness can occur. It provides a best-effort visual approximation designed to blend smoothly into surrounding textures.
Complex photographic backgrounds or intricate color gradients behind text can also pose challenging rendering conditions. In contrast, flat color fills or subtle textured backdrops generally produce the cleanest visual replacements. Knowing these nuances helps you evaluate when a pixel edit is suitable and when recreating the vector asset remains the superior choice.
Additionally, remember that pixel editors operate on static image formats like PNG, JPG, and WebP. They cannot output interactive SVG code or separated vector paths that you can manipulate later in vector illustration software. Keeping this distinction clear allows you to plan your media workflows effectively and set reasonable expectations for your design deliverables.
The Bottom Line
When original design files are lost, knowing how to modify text on a flattened image saves you from having to recreate charts from scratch. By uploading your static file, locking unchanged lines, and entering verified replacement data, you can update essential visuals responsibly. The platform provides a practical, best-effort approach that helps you keep your published visual assets current and accurate.
Always prioritize authentic data and ethical image usage whenever you publish updated graphics online. Verifying your calculations before editing ensures that your visual charts communicate truthful insights to your readers. With clear preparation and careful review, refreshing static images becomes an efficient part of your routine publishing workflow.
Sources
- https://en.wikipedia.org/wiki/Infographic
- https://en.wikipedia.org/wiki/Bar_chart
- https://en.wikipedia.org/wiki/Pie_chart